
By Chainika Thakar & Sushant Ratnaparkhi
Artificial intelligence (AI) and machine learning (ML) are revolutionising our lives in numerous ways. From the tailored recommendations we receive on shopping sites to automating the trading domain, AI makes our daily routines more efficient and enjoyable.
When it comes to the trading domain, machine learning consists of concepts like regression analysis to predict the prices in the stock market for a successful trading journey.
Let us discuss machine learning in brief and how machine learning’s linear regression plays an important role in the trading domain.
This blog covers:
- What is Machine Learning?
- The rise of Machine Learning
- What is linear regression?
- What is stock price prediction?
- Linear regression and prediction of stock prices
What is Machine Learning?
“Machine Learning is where computer algorithms are used to autonomously learn from data and information and improve the existing algorithms”.
But in simple terms, Machine Learning can be easily understood by taking this kid for example.
The following steps can be taken to make the kid learn:
- Give him a chessboard
- Explain the basic rules of the game
- Give records of say 100 good games
- Lock the kid in a room (throw in some food and water as well)

And 10 days later…

When the kid walks out of that room, you will be looking at a pretty good chess player.
Now, if we keep machines in our minds instead of the kids, the past game records are the data and the chess rule book is the algorithm. We only fed a basic algorithm to the machine and some data to learn from.
The machine sipped through the data, understood which moves improved the chances of winning the game and added those moves to the algorithm. That is the whole concept of Machine Learning. We have several Machine Learning blogs, and you can access our Top 10 on Machine Learning.
The advantage in the case of computers compared to humans is that computers can do this quickly, for bigger data sets and for a continuous period.
However, that’s just one example, there are different aspects of Machine Learning and they’re quite interesting. But we’ll stick to the basics in this post.
Also, people often get confused between Artificial Intelligence, Machine Learning, and Deep Learning. AI is a much larger space covering a lot of things, whereas Machine Learning is a part of AI and further Deep Learning is a subset of Machine Learning. Here, I have hand drawn this diagram for you.

The rise of Machine Learning
If you dig deeper, you’d find that Machine Learning has been around for a long time. For example, in 1763, Thomas Bayes published a work ‘An Essay towards solving a Problem in the Doctrine of Chances’ ⁽¹⁾ which lead to ‘The Bayes Rule’, one of the important algorithms used in Machine Learning.
But today, Machine Learning is advancing at an unprecedented speed. We might not realize it but applications of Machine Learning are everywhere, for example,
- Recommendation systems (Facebook news feed, amazon product recommendation)
- Natural language processing (Siri, google voice)
- Medical diagnosis (spotting patterns in images)
- Object recognition and tracking (facial recognition, license plate reading, and tracking)
- Mining 'Big Data' - Analytics (stock with this pattern tend to go up)
- Classification and Clustering of data (fraud detection, sequence mining etc.)
All of these things are based on the concept of learning from past data and predicting the outcome for an unseen/new situation, the same way humans learn. But the advantage of computers is that they can process data at a much larger scale and with much larger complexity, something that is simply incomprehensible to humans.
Given today’s environment where you have trillions of gigabytes of data being generated every day, it just becomes impossible for humans to process and make useful inferences out of it.
Sure, smart people might be able to make better predictions and inferences but Machine Learning algorithms beat us at the scale and complexity level. And over time the predictions made by these computers will surpass the human level.
So when every industry has started implementing Machine Learning in some form or the other, why shouldn’t you as a trader use this to your advantage to upgrade your trading skills? Guess what?
Machine Learning and trading go hand-in-hand like cheese and wine. Some of the top traders and hedge fund managers have used Machine Learning algorithms to make better predictions and as a result money!
Introduction to Machine Learning for Trading
Free Course by QuantInsti
What is linear regression?
Linear Regression is one of the most widely known modelling techniques. Linear regression establishes a relationship between a dependent variable (Y) and one or more independent variables (X) using a best-fit straight line.
If there is only one independent variable, then it is called a simple linear regression but if there is more than one independent variable, then it is called multiple linear regression.
It is mathematically represented by the following equation: Y= a+b*X + e
Where,
a = intercept, b = slope, e = error term

How to obtain the best-fit line?
The most common method for fitting a regression line is the method of least squares. It calculates the best-fit line for the observed data by minimizing the sum of the squares of the vertical deviations from each data point to the line. Because the deviations are first squared, when added, there is no cancelling out between positive and negative values.
However, the optimal regression line is the one for which the sum of the squared differences (vertical distances) between the ‘y’ values predicted by the regression equation/line and the actual ‘y’ values is minimal.
Let me explain the concept of regression in a very basic manner, so imagine that you run a company that builds cars and you want to understand how the change in prices of raw materials (let’s say steel) will affect the sales of the car. The general understanding is this, the rise in the price of steel will lead to a rise in the price of the car resulting in lesser demand and in turn lesser sales.
But how do we quantify this? And how do we predict how much change in sales will happen based on the degree of change in steel price?
That’s when the regression comes into the picture.
Let’s consider the below-mentioned sample data for understanding,
|
Price of steel |
Sales of car |
|
190 |
412 |
|
195 |
400 |
|
187 |
439 |
|
197 |
398 |
|
201 |
365 |
Let’s put this into a graph which is called a scatterplot. You can see the graph below.

In the above graph, the Y axis is the sales of a car (this is our dependent variable) and the X axis is the price of steel (independent variable). By general observation, you can tell that whenever there is a drop in steel prices the sales of the car improves.
The sample data is the training material for the regression algorithm. And now it will help us in predicting, what kind of sales we might achieve if the steel price drops to say 168 (considerable drop), which is new information for the algorithm.
We will take Excel’s help in crunching the numbers.
So when you put the sample data in an excel spreadsheet and perform regression, you will get the below-shown regression line.

Also, you will see some weird-looking numbers like these, but for basic understanding, I will only focus on a few metrics in this. The purpose of the linear regression function is to find a line that is closest to all data points so that whenever we want to calculate the prediction for a new dependent variable we can pick the subsequent point on the line corresponding to the independent variable on the x-axis.

So the above calculations were done based on the equations below, also called as regression expression.

‘Y’ - Sales of the car or dependent variable, this is what we are trying to predict
‘X’ - Price of steel or independent variable, this will be used to predict ‘Y’
‘b0’- Intercept is the value at which our regression line crosses the ‘y’ axis
‘b1’ - Slope coefficient tells us the amount of change in y that can be expected to result from a unit increase in x
‘ei’ - Error term, when the relationship we express using this equation for any variable does not fully represent the actual relationship between the independent variable and the dependent variable, the variable representing this difference is known as the error term or the residual, disturbance or remainder term
R2 - R squared or the coefficient of correlation shows how close the data is to the fitted regression line
If you look at the regression graph above, you will see a regression equation, which is
y = -4.6129x + 1297.7
So in this equation,
b1 = -4.6129
b0 + ei = 1297.7
Do notice that the slope coefficient or b1 is negative, this means that the two variables (steel price and sale of car) are negatively correlated, meaning when the price of steel rises the sale of car drops.
R2 of the equation is 0.92 which is good, we want this value to be as close to 1 as possible for better predictions.
So now coming to the awesome part, take any change in the price of Steel, for example, the price of steel is say 168 and we want to calculate the predicted rise in the sale of cars. Here’s how you do it.
(sales of car) = -4.6129 x (168) + 1297.7
Sale of car = 522.73 when steel price drops to 168
Isn’t that amazing? Guess what, even if there were multiple variables that affected the sales of a car (as there are in the real world) we would be able to calculate a prediction. When there are more than one independent variables in regression it is called a multiple regression model.
What is stock price prediction?
Stock price prediction using Machine Learning helps you discover the future value of company stock and other financial assets traded on an exchange. The entire idea of predicting stock prices is to retrieve favourable results out of investments.
There are other factors involved in the prediction of the prices of a stock such as psychological factors, rational and irrational behaviour, and so on. All these factors combine to make share prices dynamic and volatile. This makes it very difficult to predict stock prices with high accuracy. But, with linear regression, you can predict the stock prices with better accuracy as compared with other prediction methods. In order to predict stock prices, you must first learn how to obtain, visualise and analyse stock market data.
Linear regression and prediction of stock prices
Now, let us see a real-life application of regression in the stock market. For example, we are holding Amazon’s stock and want to see how changes in the NASDAQ price (index) affect Amazon’s stock price. Our aim is to find a function that will help us predict the prices of Amazon based on the given price of the index.
We will take NASDAQ and Amazon’s close prices for the last 2 months. Also, we are taking adjusted close prices for data consistency. Please note, having accurate data is very important, as even one of the numbers in the data can cause the regression function to change significantly.
Out of this data, we will treat the first 19 days as ‘training data’ and the last 19 days as the ‘test data’, wherein we will check how close the predictions made by the regression algorithm are to the actual numbers.
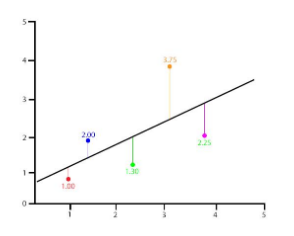
Here is the regression plot for Amazon and NASDAQ below and the scatterplot shows the data.

Using the same excel function we have drawn this regression line which has a coefficient of determination(R^2) of 0.76. This means Amazon and NASDAQ are 76% correlated.
Now, let us take a look at the regression expression as shown below,

Also, we will look at the predictions made by the machine learning regression algorithm, the predictions are marked in blue.

Looking at the data, the predictions are quite close (considering the 76% coefficient) but may not be tradable but this gives us a direction. You can and should further improve this method by adding more than one independent variable. Doing so will help reduce the residual or error and help to get you closer to the actual price.
Furthermore, here we have only taken 2 months' data, you can take years of data for more accurate results. Hence, the more the training data better the outcome.
As you add new market data to this, you will see the function will keep improving by recalculating coefficient and intercept values.
Trading with Machine Learning: Regression
Step-by-step learning | Ideal for beginners in machine learning
Now that you have learned all about Machine Learning regression and its scope in stock price prediction, it's time to take the next step to design, create, and live trade using data-driven decision-making in your trading strategy using Machine Learning.
Conclusion
Machine learning regression is an important concept for traders since stock price prediction is a part of trading. Almost all traders prefer to make a stock price prediction accurate enough to reap the benefits. Machine learning regression analysis is an efficient way to achieve the same.
If you want to learn more about machine learning regression and wish to benefit from its prediction accuracy, you should enrol into our Learning track on Machine learning and deep learning-I. From data cleaning aspects to predicting the correct market trend and optimising AI models, the courses in the mentioned learning track are perfect for beginners.
With these courses, you can learn how different machine learning algorithms can be implemented in financial markets. You can create your own prediction algorithms using regression techniques for a successful trading journey!
Note: The original post has been revamped on 18th April 2023 for accuracy, and recentness.
Disclaimer: All data and information provided in this article are for informational purposes only. QuantInsti® makes no representations as to accuracy, completeness, currentness, suitability, or validity of any information in this article and will not be liable for any errors, omissions, or delays in this information or any losses, injuries, or damages arising from its display or use. All information is provided on an as-is basis.

